Full Transcript
https://www.youtube.com/watch?v=EP4ptjamPYA
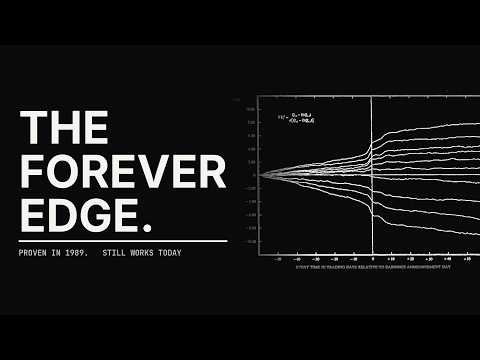
[00:00] Hello gentlemen, my name is Mat Conti.
[00:02] Hello gentlemen, my name is Mat Conti.
[00:04] I've been a market maker for 7 years.
[00:07] making more than 30 million euro for a large investment bank.
[00:09] and now I run my own hedge fund where I automate every single one of my trading strategies.
[00:15] On the side, I'm trying to kick off this YouTube channel as part of a bigger project properly educating retail traders beyond the misinformation you find online.
[00:27] So, I would really appreciate if you follow along and drop around the word in the comments like strategy to make both me and the YouTube algorithm very happy.
[00:34] Let's ride.
[00:38] Today, I want to talk about one of the first edges I've ever learned about.
[00:44] It's called PID post earnings announcement drift.
[00:48] This is one of the most documented market inefficiencies in finance history.
[00:54] Institutional traders have been making quietly billions of
[01:00] have been making quietly billions of dollars of this phenomenon since the 1980s.
[01:06] And the reason why most retail traders ignore it, it is simply they have never been told it exists.
[01:12] First, I'm going to explain you what the pit actually is and walk you through the academic research behind it.
[01:19] Second, I'm going to show you how anyone with access to the research and the right tools can take that body of work and extract a simple working trading strategy.
[01:34] So what is the PID?
[01:38] PID stands for post earnings announcement drift.
[01:41] It is a market inefficiency where stock prices continue to drift in the direction of the earnings surprise for several weeks after the earnings announcement.
[01:53] In plain English, if a company beats earnings, the stock tends to keep going up for the following weeks.
[02:02] up for the following weeks.
[02:05] If a company misses earnings, the stock tends to keep going down.
[02:08] The price reaction doesn't stop at the moment of the announcement, but it bleeds into the following sessions.
[02:13] And this might sounds obvious, but it shouldn't happen if the markets were truly efficient.
[02:19] The efficient market hypothesis, which has dominated the financial literature, says that all the public informations should be reflected into the price immediately.
[02:35] PID violates this assumption directly.
[02:39] The earning number is public.
[02:41] The surprise is measurable and yet the price keeps moving in the same direction for weeks.
[02:51] That is the definition of a market inefficiency that you can exploit.
[02:54] And the post earning announcement drift is probably the most studied anomaly in the entire academic
[03:04] studied anomaly in the entire academic finance literature.
[03:07] The first paper where the post earnings announcement drift was introduced was in 1968.
[03:14] The paper was an empirical evaluation of accounting income numbers by bull and brown.
[03:20] They were the first one to document that the stock market doesn't fully react to earnings on the day where they're announced.
[03:29] And their chart of cumulative abnormal returns for good news versus bad news became the foundational image of the entire literature.
[03:40] In 1989, Bernard and Thomas came out with the paper post earnings announcement drift delayed price response or risk premium where they formalized the methodology by sorting stocks into the sales based on earning surprise showing that the top minus bottom spread generated positive
[04:06] Minus bottom spread generated positive abnormal returns in 41 out of 48 quarters.
[04:11] With the average drift lasting for about 60 days.
[04:18] And this was the paper that turned PID into an institutional trading strategy.
[04:25] Livvenel and Mandol in 2006 with comparing the PID for surprises calculated on analyst and time series forecast brought the methodology into the modern era.
[04:39] Comparing analyst consensus forecast to time series forecast defining the standard entry and exit windows still used today.
[04:49] Lastly, think in 2021 made a comprehensive review of over 200 papers across 50 years of paid research.
[05:01] The headline, the effect persist globally.
[05:04] Four papers, 53 years.
[05:04] Discovered in 1968,
[05:10] papers, 53 years.
[05:10] Discovered in 1968, formalized in 1989.
[05:14] formalized in 1989, modernized in 2006, and confirmed in 2021.
[05:22] Most anomalies like this one get easily arbitrageed away within years from their publication.
[05:28] The post earnings announcement drift has stubbornly refused to disappear and naturally comes to question why does this still exist and the answer is mostly about investors and reaction.
[05:44] When a company reports earnings especially a surprising one the news is processed gradually across market participants.
[05:52] Institutional investors update their models and adjust positions over weeks, not minutes like you might expect.
[06:01] Sellside analysts revise their estimates over the following days.
[06:09] Retail investors mostly just look at the
[06:12] Retail investors mostly just look at the headline number and react emotionally.
[06:15] And all of this creates a slow stream of buying and selling pressure that pushes the price in the direction of the surprise for an extensive period of time.
[06:30] There are also structural limits to this arbitrage.
[06:33] Large funds cannot take massive single name positions on every single earnings events without taking on too much idiosyncratic risk.
[06:42] transaction cost eat part of the edge.
[06:45] Risk managers might have cap on exposure and all of these frictions are real and they explain why this anomaly is still around today.
[06:54] Now that we understand what the PD is, we know which are the most famous papers around it.
[06:59] Let's extract a trading strategy from the very same research.
[07:05] A complete trading strategy needs three things.
[07:07] an entry condition, an exit condition, and
[07:12] condition, an exit condition, and position sizing.
[07:14] For the entry conditions, the literature tell us to use both earning surprise and the price reaction.
[07:21] The earning surprise tell us the fundamental news.
[07:27] The price reaction confirms how the market interprets it.
[07:30] And when both the surprise and the price direction agree, we call it a concordant signal.
[07:36] And our entry rule is straightforward.
[07:41] If a company reports earnings above the consensus and the stock reacts positively, we go long.
[07:48] If a company reports earnings below consensus and the stock reacts negatively, we go short.
[07:58] If the surprise and the reaction disagree, we don't trade.
[08:01] Now one thing we need to consider is the timing because company can report after market closes or before market opens.
[08:06] For the after market close
[08:13] Opens.
[08:13] For the after market close announcement, the reaction day is the announcement, the reaction day is the next trading day because the news only becomes effective when the market opens.
[08:23] For before markets open announcements, the reaction day is going to be the same day because the market opens with the news already public.
[08:31] In both cases, we enter at the open of the following session after the full reaction has been played out.
[08:40] As exit condition, Bernard and Thomas show that the drift last for around 60 trading days.
[08:48] So we use a simple timebased exit hold the position for 60 trading days to which at the end we will close it meaning no stop loss no take profit in our basic version and that's because the drift is statistical it is not just directional and putting a tight stop-loss on a 60 days hold would
[09:15] Tight stop-loss on a 60 days hold would cut our winners systematically.
[09:19] And cut our winners systematically.
[09:19] And finally, position sizing.
[09:21] We start simple with a fixed percentage of capital per trade, and we're going to go for 10% per position, and we will run it on a $100,000 account.
[09:24] simple with a fixed percentage of capital per trade, and we're going to go for 10% per position, and we will run it on a $100,000 account.
[09:27] capital per trade, and we're going to go for 10% per position, and we will run it on a $100,000 account.
[09:30] for 10% per position, and we will run it on a $100,000 account.
[09:33] on a $100,000 account. In this way, we won't take any insane single stock exposure.
[09:37] won't take any insane single stock exposure. And that's the full strategy.
[09:39] exposure. And that's the full strategy. three rules.
[09:39] three rules. No discretion, no optimization, pure mechanical execution of what 60 years of academic research suggest should work.
[09:42] No discretion, no optimization, pure mechanical execution of what 60 years of academic research suggest should work.
[09:46] optimization, pure mechanical execution of what 60 years of academic research suggest should work.
[09:50] of what 60 years of academic research suggest should work. And let me stress it again, all we did was taking public research and extracting the elements for our training strategy on an edge that has been known for more than half a century.
[09:53] suggest should work. And let me stress it again, all we did was taking public research and extracting the elements for our training strategy on an edge that has been known for more than half a century.
[09:57] it again, all we did was taking public research and extracting the elements for our training strategy on an edge that has been known for more than half a century.
[10:00] research and extracting the elements for our training strategy on an edge that has been known for more than half a century.
[10:03] our training strategy on an edge that has been known for more than half a century.
[10:06] has been known for more than half a century. We are literally not reinventing anything here.
[10:08] century. We are literally not reinventing anything here.
[10:10] reinventing anything here. Just leveraging the work of people which most likely are much smarter than the two of
[10:15] leveraging the work of people which most likely are much smarter than the two of
[10:18] likely are much smarter than the two of us.
[10:20] And now what is left to do is the practical side gathering the data getting the code and testing the strategy.
[10:28] To develop this strategy, we need two things.
[10:30] Price data and I will use daily data from Trade Station directly in multi charts and earnings data.
[10:35] Which is the tricky part.
[10:39] For earnings data, you need four main columns.
[10:41] Announcement date, announcement timing flag, if it's before market open or after market close, the actual earning per share, and the consensus estimate before the announcement.
[10:55] And the surprise is simply the difference between the reported and the estimate.
[11:00] And there is many providers you could pay and get all this data from.
[11:07] But here my challenge is proving you can do all of these minimizing the cost of your infrastructure.
[11:14] So we will gather all these earnings data 100% for free.
[11:20] These earnings data 100% for free.
[11:23] One good source is zax.com which gives you all the earnings estimate and surprises.
[11:27] For individual stocks including the timing flag and that's the data that I'm going to use.
[11:32] Obviously there is the risk that the data quality is not as good as paid providers but this will do for this example.
[11:41] If you just want to be effective without spending a scent, all you need to do is enter in the symbol of the stock you're interested in, copying the data, and pasting them into your Excel.
[11:51] Creating a data set with all the earnings events for the stocks you're interested in.
[11:57] The question is, which stocks should we use for this big test?
[12:02] For this test, I picked 20 US stocks spanning across multiple sectors.
[12:09] Tech, consumers, financial, healthcare, industrial and energy.
[12:15] Why these 20 stocks specifically?
[12:19] I deliberately
[12:21] Stocks specifically?
[12:25] I deliberately mixed sectors so we are not just testing on tech stocks.
[12:28] I included some stocks which struggled over the past 8 years like Nike, Starbucks and Lily to avoid that the result is going to be just go long stuff that went up.
[12:38] But there is a selection bias here that however if the strategy works it is likely it will play to our advantage.
[12:48] All of these stocks are large surviving and well followed companies.
[12:56] The post earnings announcement drift is known to work better on smaller, less followed stocks where information uncertainty is higher and where there are fewer professional eyes watching the earnings.
[13:12] Meaning that testing on these large 20 stocks put this strategy in its hardest difficulty.
[13:22] this strategy in its hardest difficulty setting.
[13:26] If this strategy works here, it should work even better on a broader universe of small and midcaps.
[13:33] I got the earnings data for all these stocks from January 2018 to April 2026, which give us 658 earnings events across 20 stocks over the past eight years.
[13:48] With the strategy defined and the data collected, we now move to code.
[13:54] And as I mentioned in my previous videos, now you have access to large language models.
[13:57] Use them clearly.
[14:00] Explain the strategy that you are investigating and if you have them which are the rules that you want to follow and if you want to do it quick and dirty.
[14:10] You can even load the data set to charge GPT or code for specific data like the earnings events asking to
[14:24] like the earnings events asking to hardcode those data into the script.
[14:28] hardcode those data into the script.
[14:30] And this is exactly what I did for this example.
[14:33] In mind, this is not the most efficient and clean way, but this allow
[14:36] you to be effective, especially in a setting where you are researching.
[14:39] Doing like this just in minutes, I got a fully
[14:42] working code with the full strategy fitting in just one script with our
[14:46] entry, exit, and position sizing properly encoded.
[14:49] Now that we have the code, let's apply it to just one stock.
[14:53] And I'm going to take Google as an example.
[14:58] And note that I'm going to use exactly the default settings that we specified from the research.
[15:02] We open a long position if there is a positive surprise in the earnings.
[15:04] And on the day of the earnings, the stock moves up.
[15:06] Equally, we open a short position if
[15:24] Equally, we open a short position if there is a negative surprise and the stock moves down.
[15:31] We will hold that position for the following 60 trading days.
[15:38] No stop losses, no take profits, just like we got it from the insights of the papers.
[15:43] Let's apply to Google.
[15:45] And as you can see, trades starts populating.
[15:48] To do a very quick cross reference, I open Trading View as well where for example we had a positive surprise on the 23rd of July 2025 and the closing price of the following day is above the closing price of the day where the earnings have been released.
[16:08] Meaning that there is a positive reaction in the price.
[16:13] If this holds, we should have open a position into our multi charts.
[16:21] And indeed, we did open a long position as the earnings has been released.
[16:24] There has been the price
[16:26] Released. There has been the price reaction which from close to close the price has been increasing.
[16:31] We had a positive surprise.
[16:34] So at the opening of the following trading session, we did open a long position which we held for the following 60 days.
[16:42] Or if you want to use your own data to cross check here on the 2nd of February 2023, we should have for Google an earning release.
[16:52] So 2nd of February 2023, we have a miss on the earnings.
[16:56] So a negative surprise and the price reaction it is negative because from close to close the price decreased.
[17:09] So at the opening of the following session we did open a short position.
[17:15] And given the fact that the logics for both the long and the short trades holds, we can apply the strategy to all 20 stocks simultaneously.
[17:21] And if the post earnings
[17:27] simultaneously.
[17:31] And if the post earnings announcement drift is real, we should see a positive and apprising equity curve.
[17:37] Let's run the first back test.
[17:39] And look at this.
[17:42] The equity curve is not perfect, but we do have the result that we're looking for.
[17:45] We have a profit for $131,000 on a $100,000 capital with a 17.4% 4% max portfolio draw down a profit factor of 1.99 a 61% win rate and an annualized result of around 12%.
[18:07] If we have a look at the kalma ratio which is given by the annual return divided by the maximum portfolio draw down it lands at around 0.68 68.
[18:20] And all of these tell us that this is real.
[18:23] We do have a working strategy at the first try with parameters straight out of
[18:29] Try with parameters straight out of academic research.
[18:33] No optimization, no core fitting, just the rules as published applied to a basket of US liquid stocks giving us this alone a very meaningful result.
[18:47] And now let's have a look if we start tweaking the parameters.
[18:52] Let's investigate a second configuration.
[18:54] Let's use exactly the same as configuration one but without the concordant filter.
[19:01] Meaning that if we have a positive surprise, we go long.
[19:04] If we have a negative surprise, we go short.
[19:07] But we don't care about what is going to be the following day price reaction.
[19:12] And let's run the big test.
[19:15] Here we get a net profit of $251,000 with a $32.5% draw down.
[19:23] Almost double the return but almost double the draw down as well.
[19:30] almost double the draw down as well giving us a calm ratio of 0.69.
[19:34] giving us a calm ratio of 0.69.
[19:37] Let's run a configuration number three with concordant filter still off.
[19:40] We don't care if the surprise and the price reaction match in direction but we filter out small surprises below 5%.
[19:43] don't care if the surprise and the price reaction match in direction but we filter out small surprises below 5%.
[19:47] filter out small surprises below 5%.
[19:50] below 5%.
[19:52] And the idea is to focus on high magnitude earnings surprise event.
[19:55] And the idea is to focus on high magnitude earnings surprise event.
[20:00] The result is a net profit of 191,000 a 26% draw down giving us a calma ratio of 0.67.
[20:03] result is a net profit of 191,000 a 26%
[20:06] a 26% draw down giving us a calma ratio of 0.67.
[20:09] draw down giving us a calma ratio of 0.67.
[20:09] 67 configuration number four.
[20:13] Both filters are on, meaning concurrent filter plus a 5% threshold.
[20:16] filters are on, meaning concurrent filter plus a 5% threshold.
[20:21] And here we get something interesting, a net profit of almost $82,000 and a max portfolio draw down of 20%.
[20:23] get something interesting, a net profit of almost $82,000
[20:26] of almost $82,000 and a max portfolio draw down of 20%.
[20:29] and a max portfolio draw down of 20%.
[20:29] Showing us that the calm ratio dropped
[20:32] Showing us that the calm ratio dropped to 0.36.
[20:34] to 0.36. So stacking the two filters actually
[20:38] So stacking the two filters actually broke this strategy and this is the most
[20:41] broke this strategy and this is the most educational moment of this entire
[20:44] educational moment of this entire research because it's telling us that
[20:46] research because it's telling us that these two filters are doing partially
[20:49] these two filters are doing partially overlapping work and combining them
[20:53] overlapping work and combining them removes a small but high quality signal
[20:58] removes a small but high quality signal that were carrying the strategy and this
[21:01] that were carrying the strategy and this is a real finding. Research papers often
[21:05] is a real finding. Research papers often suggest
[21:06] suggest multiple filters, but they rarely test
[21:10] multiple filters, but they rarely test them together. And just as we have seen
[21:13] them together. And just as we have seen here, the interaction can have a
[21:17] here, the interaction can have a negative result. You can only see this
[21:22] negative result. You can only see this running this exact type of test. Now,
[21:26] running this exact type of test. Now, look at something interesting as well.
[21:28] look at something interesting as well. Every time that we run a big test, our
[21:31] Every time that we run a big test, our short legs are always negative between
[21:35] short legs are always negative between minus14 and - $19,000.
[21:40] minus14 and - $19,000. And this is not a bug. This is a real
[21:43] And this is not a bug. This is a real market asymmetry that the modern pedal
[21:46] market asymmetry that the modern pedal literature documents clearly. In the
[21:50] literature documents clearly. In the post2010
[21:52] post2010 era, positive surprises
[21:55] era, positive surprises drift more reliably than negative ones.
[22:00] drift more reliably than negative ones. Especially on large cap stocks,
[22:03] Especially on large cap stocks, companies often pre-announce bad news.
[22:07] companies often pre-announce bad news. Management guides expectations during
[22:10] Management guides expectations during the earnings calls. Activist highly
[22:14] the earnings calls. Activist highly shorts companies before the earnings is
[22:17] shorts companies before the earnings is out and by the time the formal release
[22:21] out and by the time the formal release of the earnings is out, most of the
[22:24] of the earnings is out, most of the negative reaction is already priced in.
[22:26] negative reaction is already priced in. And this inside bring us to remove the
[22:31] And this inside bring us to remove the short leg completely. running condition
[22:34] short leg completely. running condition five as long only concordant filter
[22:39] five as long only concordant filter still on without any threshold because
[22:43] still on without any threshold because we have seen that is not adding any
[22:45] we have seen that is not adding any value. We get a net profit of $146,000
[22:51] value. We get a net profit of $146,000 a 20% max portfolio draw down a profit
[22:56] a 20% max portfolio draw down a profit factor of 2.68 68 a win rate of 63%.
[23:02] factor of 2.68 68 a win rate of 63%. Giving us the cleanest by the book
[23:07] Giving us the cleanest by the book version we have produced. What this
[23:10] version we have produced. What this proves, the post earnings announcement
[23:14] proves, the post earnings announcement drift as documented in academia from
[23:18] drift as documented in academia from 1968
[23:20] 1968 to 2021
[23:22] to 2021 still works on a diversified basket of
[23:25] still works on a diversified basket of large US stocks. The edge is modest, but
[23:30] large US stocks. The edge is modest, but it is real with a calma ratio between
[23:34] it is real with a calma ratio between 0.66 66 to 0.76
[23:38] 0.66 66 to 0.76 depending on the configuration that you
[23:41] depending on the configuration that you want to use. And what matters is that
[23:43] want to use. And what matters is that this is just the starting point. From
[23:47] this is just the starting point. From here you can extend this strategy in
[23:50] here you can extend this strategy in several directions. You can test the
[23:53] several directions. You can test the post earnings announcement drift on less
[23:56] post earnings announcement drift on less liquid stocks. Given the fact that the
[23:59] liquid stocks. Given the fact that the literature strongly suggests that this
[24:02] literature strongly suggests that this effect is stronger on small caps, mid
[24:06] effect is stronger on small caps, mid caps and stocks with less analyst
[24:09] caps and stocks with less analyst coverage. You can test it on stocks
[24:12] coverage. You can test it on stocks based on other countries like in Europe
[24:15] based on other countries like in Europe or Asia. Or again, you can combine the
[24:18] or Asia. Or again, you can combine the PID with other signals. And of course,
[24:22] PID with other signals. And of course, as I said before, there is more
[24:23] as I said before, there is more sophisticated ways of doing this. You
[24:27] sophisticated ways of doing this. You can use Python for proper
[24:29] can use Python for proper cross-sectional analysis. Doing a much
[24:32] cross-sectional analysis. Doing a much more indepth analysis of this
[24:34] more indepth analysis of this phenomenon. But what is relevant here
[24:38] phenomenon. But what is relevant here and what I want you to understand is
[24:40] and what I want you to understand is that if you knew the process and you
[24:43] that if you knew the process and you followed the proper protocol with just
[24:46] followed the proper protocol with just using tools that you have access to
[24:49] using tools that you have access to without knowing how to code a single
[24:52] without knowing how to code a single line. you would have been able to
[24:55] line. you would have been able to reproduce this exact research and you
[24:59] reproduce this exact research and you would be able to leave all the old
[25:02] would be able to leave all the old retail trading methodologies you're
[25:04] retail trading methodologies you're relying on today. We took a phenomenon
[25:07] relying on today. We took a phenomenon documented in academic research. We
[25:10] documented in academic research. We extracted the rules for a simple trading
[25:13] extracted the rules for a simple trading strategy. We sourced free data. We coded
[25:17] strategy. We sourced free data. We coded the strategy using tools that any single
[25:20] the strategy using tools that any single one of you has access to. We tested it
[25:24] one of you has access to. We tested it on 20 stocks simultaneously over eight
[25:28] on 20 stocks simultaneously over eight years of data and we found the
[25:31] years of data and we found the confirmation for a real positive risk
[25:35] confirmation for a real positive risk adjusted edge. And this is what I mean
[25:39] adjusted edge. And this is what I mean when I say that anyone can do this
[25:42] when I say that anyone can do this today. But still you need to know what
[25:45] today. But still you need to know what you're looking for, where to find it,
[25:48] you're looking for, where to find it, and how to ask the right questions. That
[25:52] and how to ask the right questions. That by definition is the institutional
[25:54] by definition is the institutional protocol and that's what this channel is
[25:58] protocol and that's what this channel is about. If you found this interesting and
[26:01] about. If you found this interesting and useful, please drop a comment, subscribe
[26:05] useful, please drop a comment, subscribe to the channel because we are just
[26:08] to the channel because we are just getting started. That